
Tour of the window
What each part of the Ghostex window does.
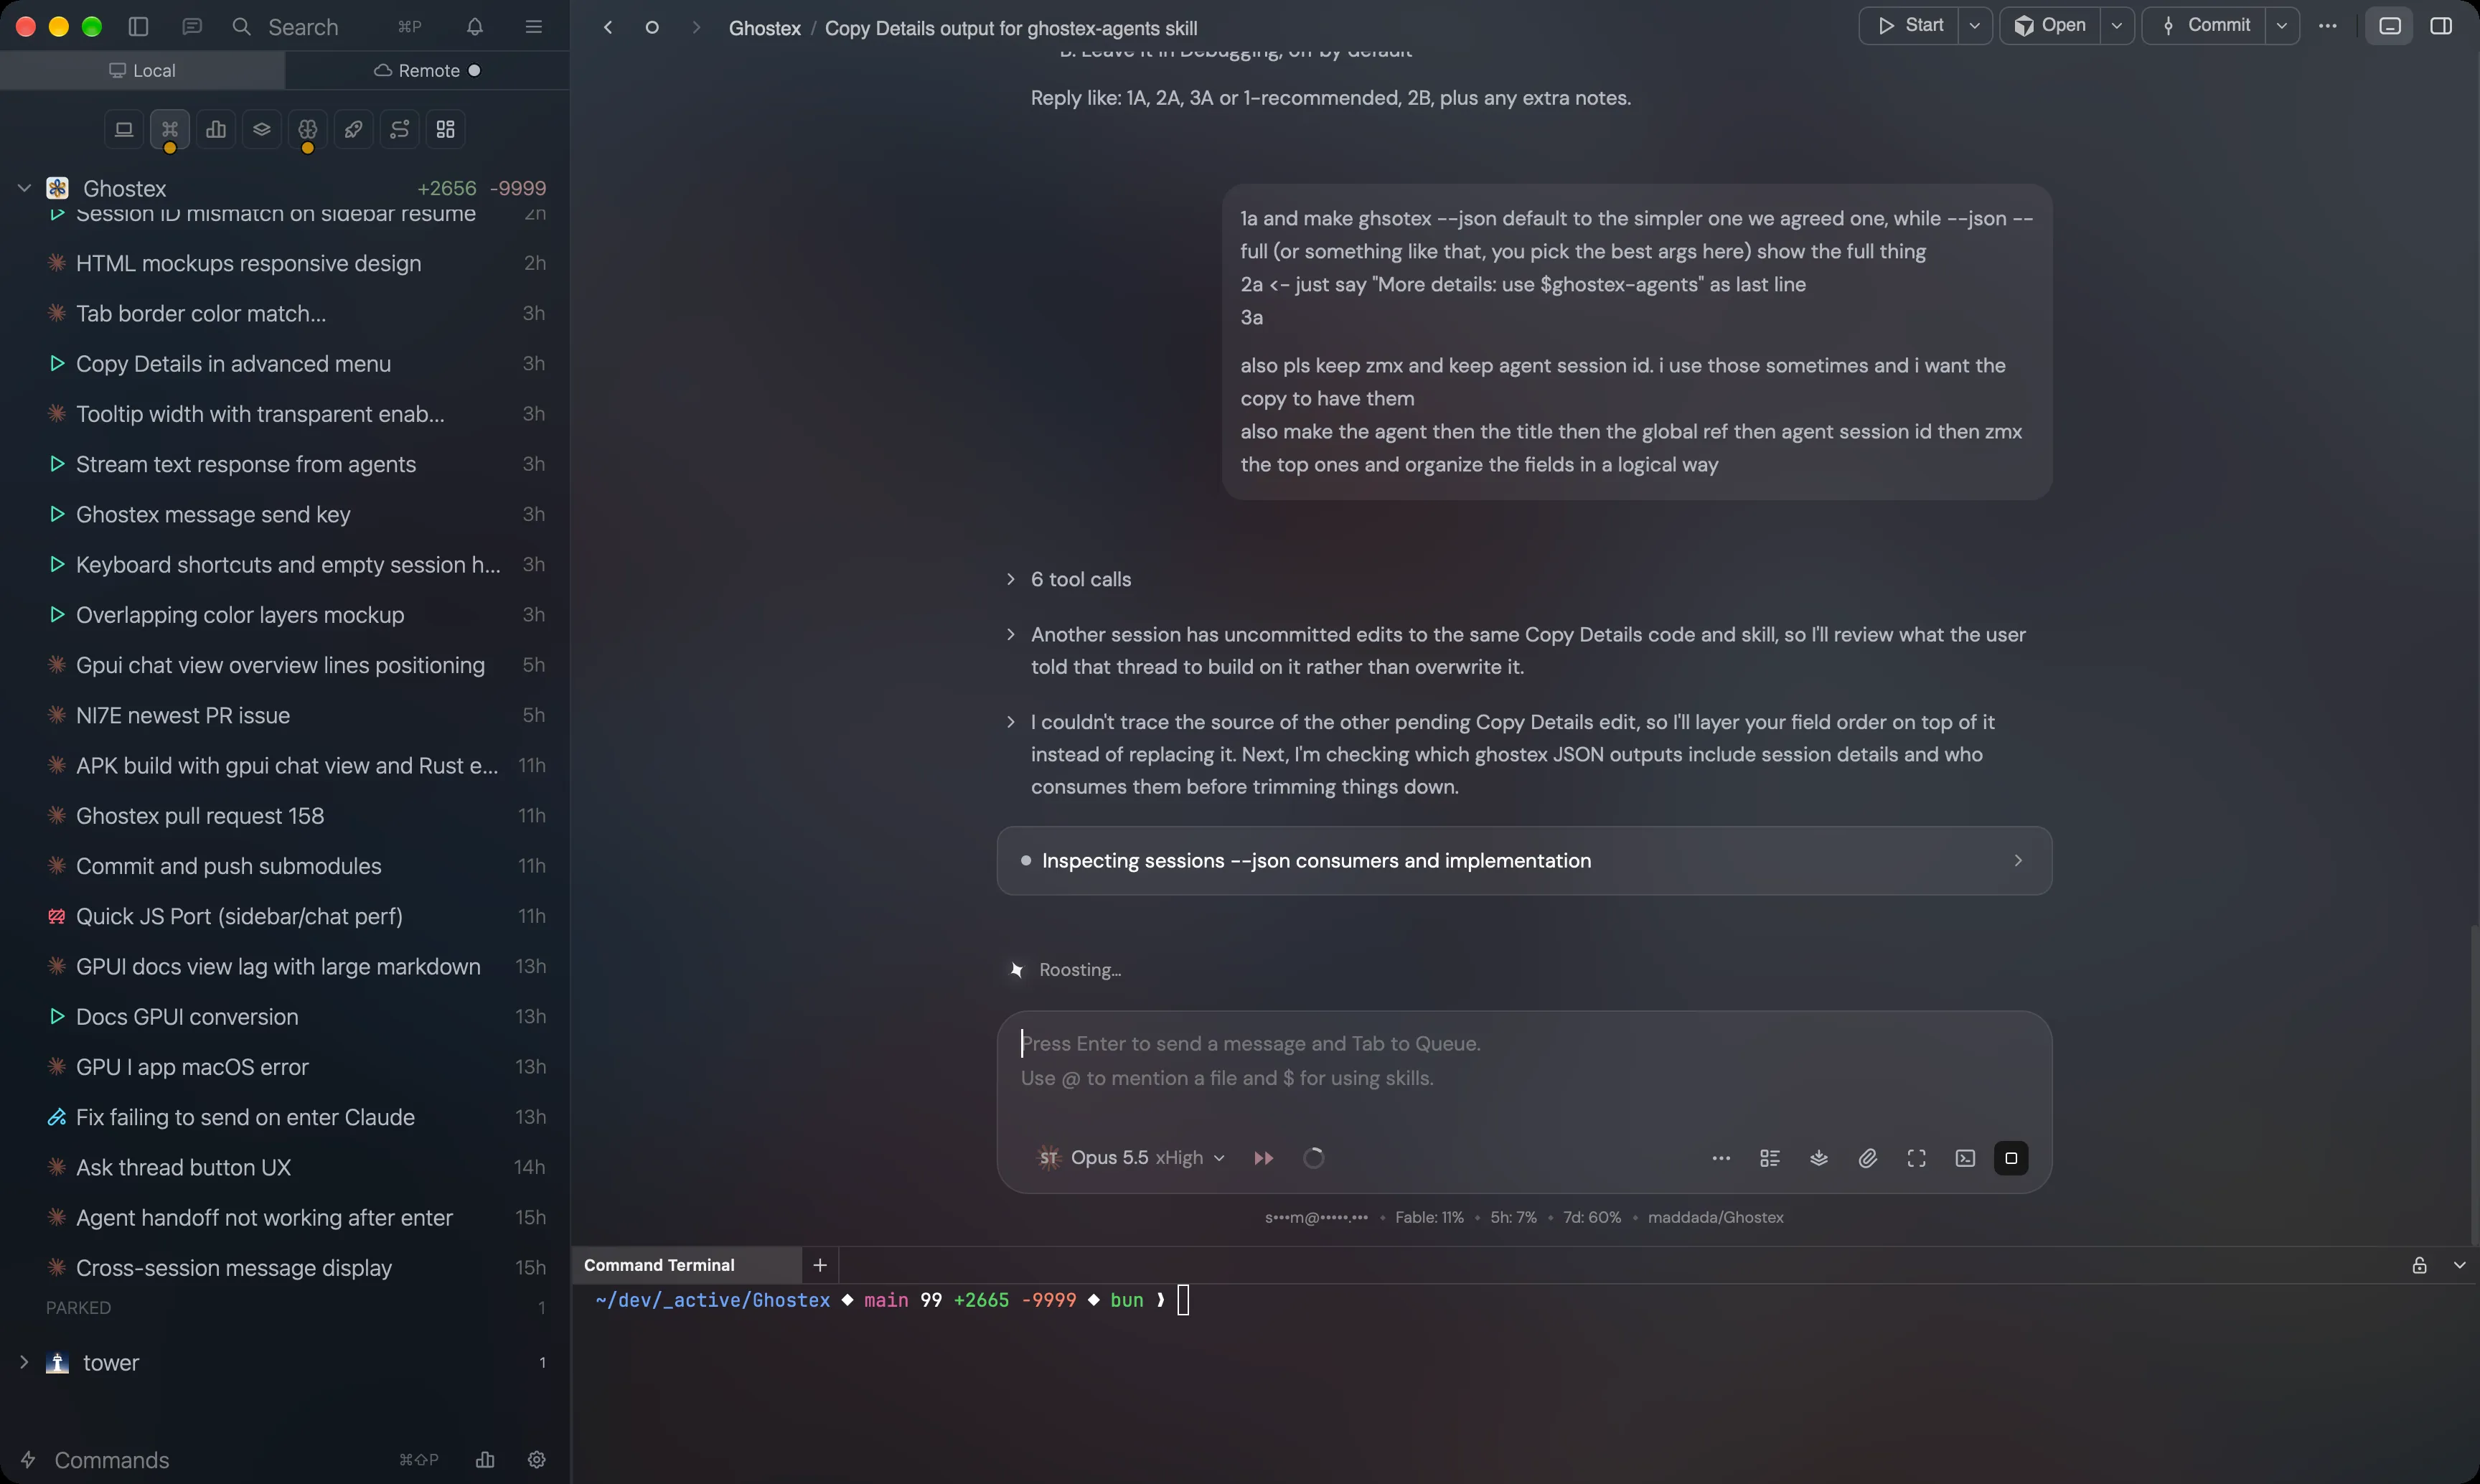
The window has three parts: the sidebar on the left, your sessions in the middle, and an optional view panel on the right.
Sidebar
Your projects and their sessions. From top to bottom:
- Top row: hide the sidebar, search, the Notifications bell, and the More Options menu (Add Project, Search by Prompt, Previous Sessions, Agents Hub, All Automations, Mobile & Remote).
- Computers: Local is this computer. Other computers you connect appear next to it.
- Spaces: icons that group projects together, so you can focus on one set of work at a time.
- Projects and sessions: click a session to open it. Colored dots show its state (see below).
- Bottom row: Commands (Quick Access), your account usage meters, and the Settings gear.
| Dot | Meaning |
|---|---|
| Orange | The agent is working. |
| Blue | The agent finished. |
| Pink | The agent is waiting for your answer. |
Sessions
The middle of the window shows the session you picked. Each session can show a chat or the raw terminal of the same agent. You can split the area to watch several sessions at once. See Sessions.
The header above it shows where you are (project and session name) and, on the right:
- Start: run one of your saved Actions, such as
npm run dev. - Open: open the project in another app, like your code editor or file manager.
- Commit: git actions such as commit, sync with main, and review.
- ⋯: Ask Ghostex, Tips & Tricks, Resources (CPU and memory per session), Dev servers, and Extensions.
- The last two buttons show or hide the Commands pane (a terminal below your sessions, Cmd+J, or F12 on Windows and Linux) and the view panel.
View panel
Code, Browser, Docs, Kanban and Automate open here, beside your sessions, so your agents stay in view. Drag the divider to resize it. See Views.